Multi-well log visualization
Place two or more wells on one chart and move between them with the well selector.
MULTI-WELL LOGS IN THE BROWSER
Visualize and compare well logs from multiple wells, correlate geological formations, display digital LAS curves, and create professional correlation charts directly in your browser.
LAS, Excel and CSV well logs · formation tops · PNG, PDF and PowerPoint export One free log and five data-file imports per account · no installation
ONE WORKSPACE
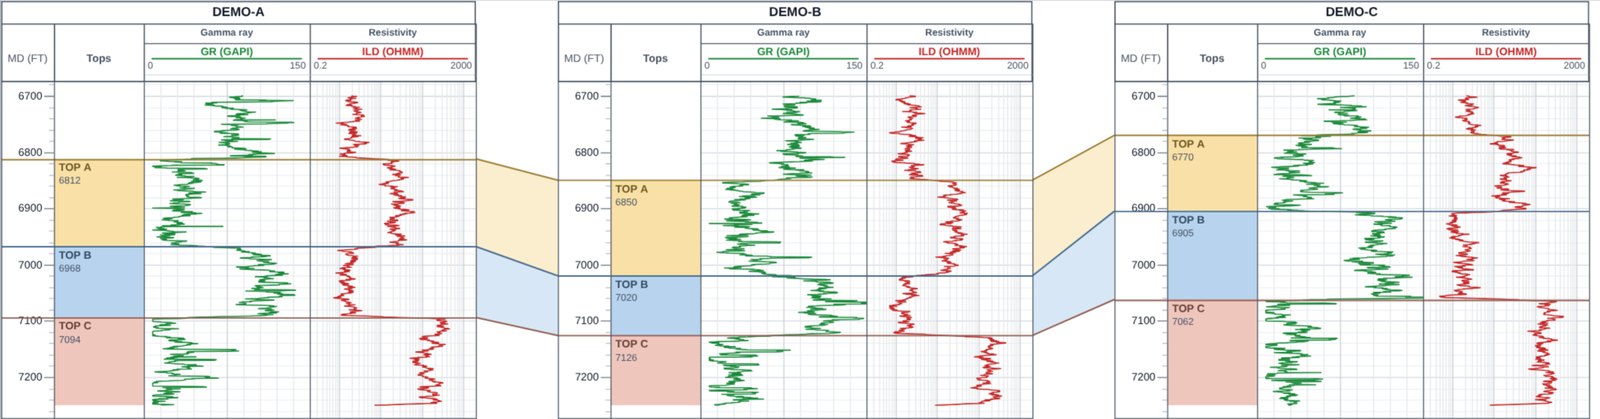
Log Digitize brings the logs of several wells onto one chart so you can compare curves across wells at the same depth scale. This is multi-well log correlation in LogPlot Studio, with LAS file correlation, tops and print-ready charts in a single browser tool.
Place two or more wells on one chart and move between them with the well selector.
Open LAS files, choose the curves to show, and add each file as a new well or to an existing one.
Each well keeps its own tracks, and the chart lines the wells up next to each other.
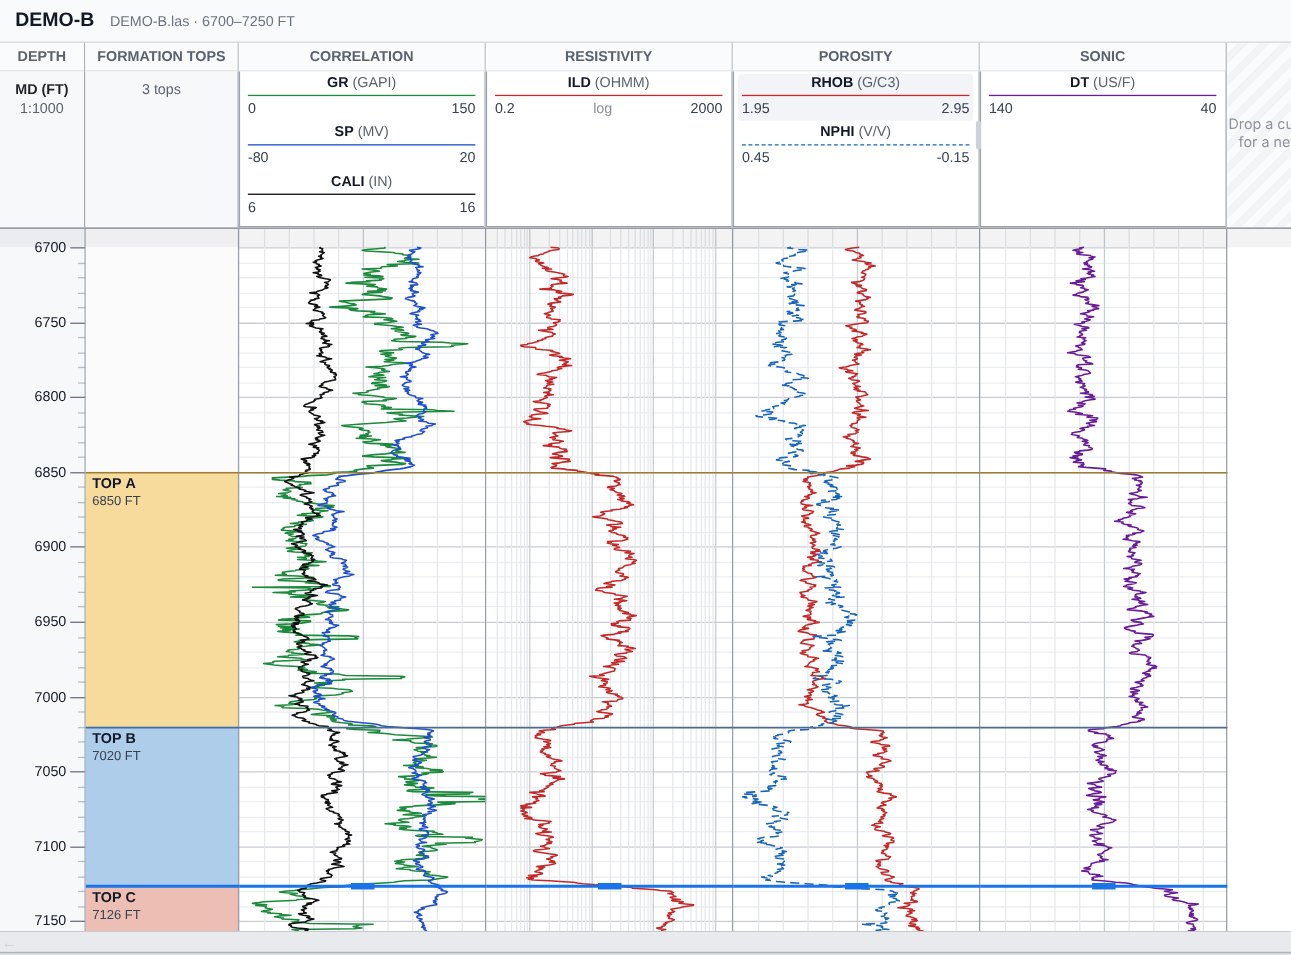
Gamma ray, resistivity, density, neutron and sonic curves start with typical scales and track layouts.
Change each curve's left and right values and choose linear or logarithmic scale.
Wells share a depth scale (for example 1:500), and you can flatten the wells on a formation top.
Formation tops carry names, depths and colors; matching names are connected between wells with optional zone fill.
Choose tracks, spacing and fonts, then use the publication layout and export to PNG, PDF or PowerPoint.
DIGITAL LOGS
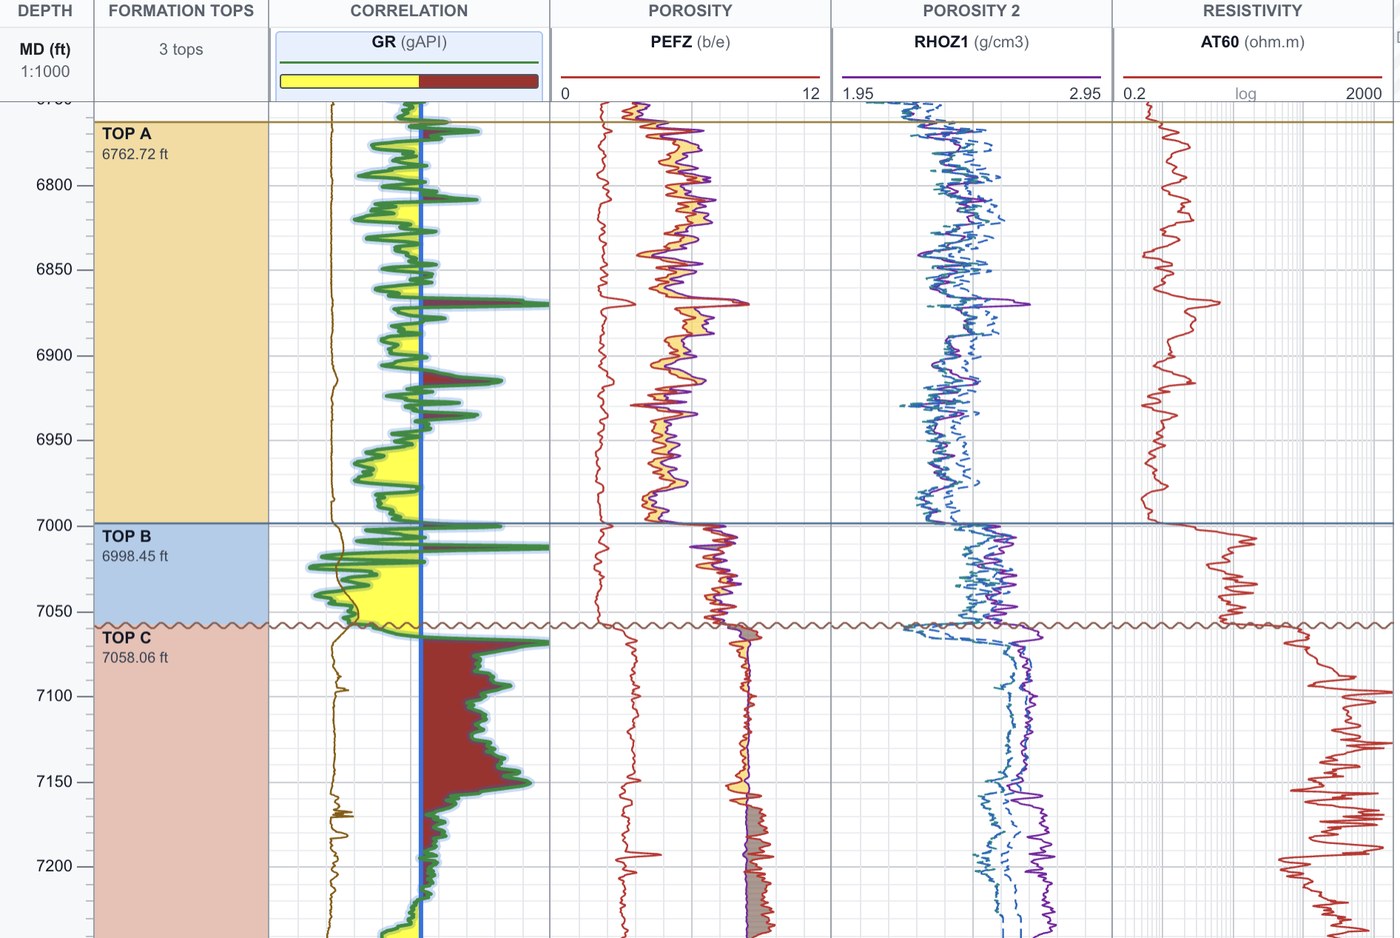
Open one or more LAS files in LogPlot Studio. For each file you decide whether it becomes a new well or is added to an existing one, and you choose which curves to show. The curves arrive grouped by type with typical scales, so a gamma ray, resistivity, density, neutron and sonic set already looks like a standard log display.
From there you can change the display: colors, scales, track widths, track order and fonts. It also works as a multi-well LAS viewer for quick checks (see open and plot LAS files online), and the same workspace opens Excel, CSV and text logs. Logs from scans can come from well log digitizing first.
STRATIGRAPHIC CORRELATION
Formation correlation compares log character and tops between wells to interpret how a unit continues across an area. The software draws and organizes what you pick; it does not decide where a formation top is, and it does not guarantee that a correlation is correct. Those interpretations are yours.
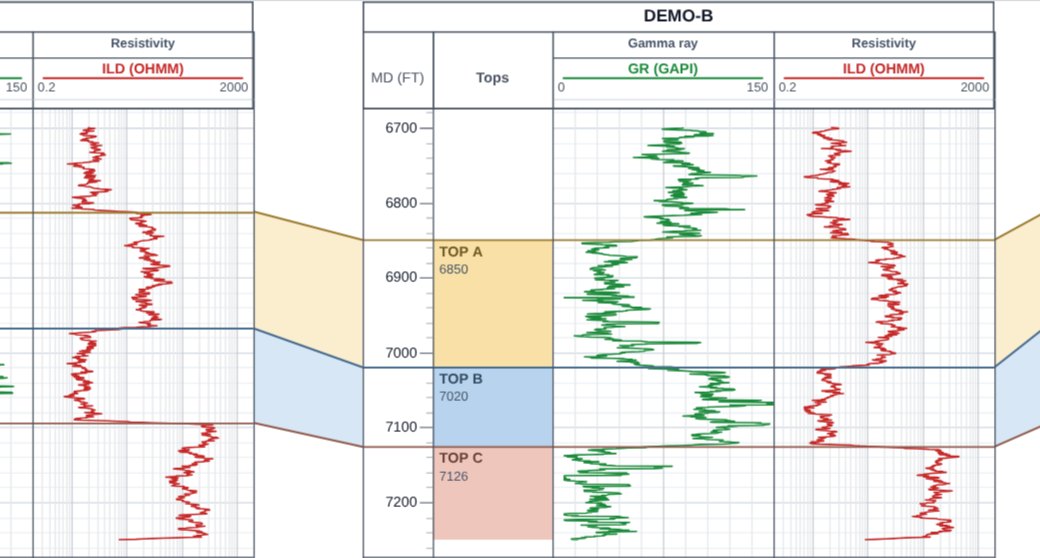
Pick a formation top at a depth in each well and give it the same name; the chart then connects the matching tops and fills the zones between them. Use the chart for:
Related guides: how to make a well correlation chart and how to pick formation tops.
DISPLAY CONTROLS
These controls are built into LogPlot Studio.
FOUR STEPS
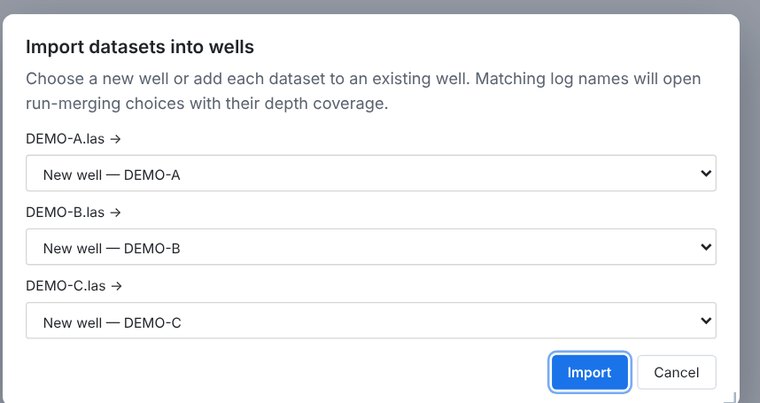
Load LAS files, or Excel, CSV and text logs, and choose whether each file is a new well.
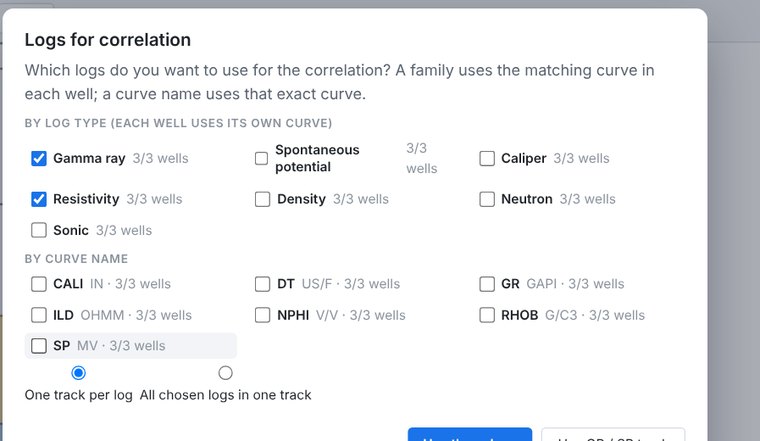
Choose the wells and the curves to compare, then arrange the tracks.
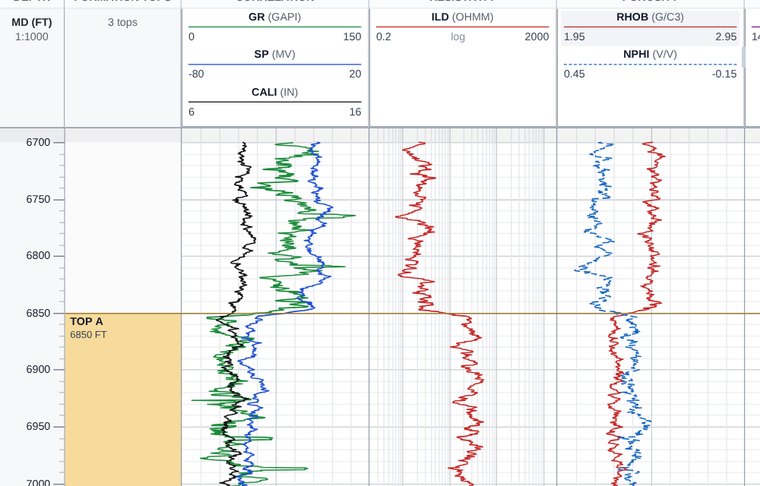
Pick tops on the logs, name them, and adjust their depths and colors as your interpretation changes.
Turn on the correlation chart to compare intervals across wells, then export it as PNG, PDF or a PowerPoint slide.
WHERE IT HELPS
Log Digitize displays and organizes your data. Evaluating reservoir quality, storage capacity or geological safety is work the geoscientist does with the results.
Compare log character and thickness of reservoir intervals between wells, with porosity, resistivity and gamma ray curves on one depth scale. Interpretation of quality remains with you.
Tie units from well to well using log signatures and your own formation tops, and see where intervals thicken, thin or pinch out. Flatten on a top to look at thickness changes.
Lay out wells across a site to compare the reservoir and sealing intervals you interpret in each well, as part of subsurface characterization. The software displays the data; it does not assess storage capacity or containment.
Correlate legacy and new wells in a prospect area, compare tops between wells and prepare charts for review. Scanned legacy logs can be digitized first.
Compare gamma ray, resistivity and SP logs from water and monitoring wells to follow aquifer and confining units between boreholes, where such logs exist.
Build consistent correlation charts for reports, publications, theses and teaching, and export vector PDF, PNG or PowerPoint slides.
TWO WORKFLOWS
Converting scanned or paper well-log curves into digital numerical data, by calibrating the scales on the image and tracing each curve.
Displaying and comparing curves from multiple wells to interpret geological continuity and formation relationships.
The two fit together in one workspace. Old wells that exist only as paper can be traced with well log digitizing software, sent to LogPlot Studio, and correlated with wells that already have LAS data.
QUESTIONS
Well log correlation software displays logs from several wells on a common depth scale so that a geologist can compare log character and formation tops between them and interpret how units continue, thicken, thin or change laterally. In Log Digitize this is done in LogPlot Studio.
Yes. Open the logs of two or more wells in LogPlot Studio and turn on the correlation chart. The wells sit side by side, and tops that share a name are joined between wells.
Yes. You can open LAS files, and also Excel, CSV, TSV and text data. For each file you choose which curves to show and whether it becomes a new well or joins an existing one. Curves you digitized from scans can be sent to LogPlot Studio as well.
Yes. Any curve in your data can be displayed. Curves are recognized by family (gamma ray, resistivity, density, neutron, sonic, caliper, SP and others) and start with a typical scale, for example resistivity on a logarithmic scale and neutron porosity reversed. You can change every scale.
Yes. Type a formation name, pick the top on the log at the depth you choose, and adjust it afterwards by editing its depth or moving it. You can also use a top as a datum to flatten the wells. Top names, depths and colors are your interpretation.
Yes. Set each curve's left and right values and a linear or logarithmic scale, change curve colors and names, add, move and delete tracks, set track widths, choose the depth scale, and pick fonts for headers and log text.
No. Log Digitize runs in a modern web browser. You sign in to use the workspace.
Yes. Export the chart as a PNG (standard or high resolution), a vector PDF (chart-sized, Letter or A4 landscape, or a custom size), a PowerPoint slide, or print it, and use the publication layout and print preview. You can also export the tops as CSV and the wells and tops as an Excel workbook or LAS 2.0 or LAS 3.0 files.
Yes. Each account starts free with one scanned log and five imported data files, such as LAS files. Each additional log costs $10 and adds five more data-file imports. Three-month ($100) and annual ($300) plans are also available. Current details are on the pricing section of the home page; it is not unlimited free use.
On your computer. Log files, tops and charts are processed in your browser and saved in a folder you choose or as files you download; they are not uploaded to or stored on the Log Digitize website. The account side keeps only sign-in, purchase and allowance records. See the privacy policy.
Explore your well-log data, compare formations across wells, and create professional geological correlation charts with browser-based tools.
Open LogPlot StudioOne free log and five data-file imports per account. See pricing · Read the guides