Manual curve tracing
Click anchors or draw a smooth pen stroke along the printed curve. Trace downward or upward, move or delete anchors, and undo. A new stroke replaces only its own depth span.
SCANNED WELL LOGS TO DIGITAL CURVES
Convert scanned well logs into editable digital curves using browser-based digitizing tools. Calibrate depth and curve scales, trace curves, review results, and export digital well-log data in LAS format.
PDF, TIFF, PNG, JPEG and WebP scans · LAS 2.0, LAS 3.0 and CSV export One free log per account · no installation
STEP FROM PAPER TO DATA
Many older wells exist only as paper logs. Log Digitize is a well log digitizer that works on a picture of the log: open the scan, tell the software two known depths and each curve's left and right scale values, then trace the curve. Position on the image is converted to depth and curve value, so you can digitize geophysical logs and geological curves such as gamma ray, resistivity or sonic into digital data you can use in other software.
You can digitize scanned well logs from PDF, TIFF, PNG, JPEG and WebP files, including multi-page PDF logs. It works as a PDF well log digitizer, and the full routine is covered in the guide on how to digitize a well log. Calibration and tracing happen in your browser, and you review everything before you export.
THE TOOLS IN THE WORKSPACE
Use automatic tracing for speed and the pen for control. Both feed the same curve, so you can mix them on one log.
Click anchors or draw a smooth pen stroke along the printed curve. Trace downward or upward, move or delete anchors, and undo. A new stroke replaces only its own depth span.
Right-click the printed curve to follow it automatically. Automatic well log digitization is a starting point: it protects what you already traced, and you correct the result where it drifts.
Enter two known depths and pick their marks on the scan, in feet or metres. Ties and breaks are available in the advanced tools.
Set each curve's left and right values and choose a linear or logarithmic scale, with a backup scale for curves that wrap around the track. How scale calibration works.
Select a section and redraw it, or adjust anchors. Data checks flag values outside the printed scale, spikes and gaps before you export.
Add every curve on the log, each with its own name, unit and calibration, and digitize them one after another from the same scan.
Export LAS 2.0, LAS 3.0 or CSV at the sampling interval you choose; untraced depths stay null (−999.25). See scanned well log to LAS and LAS 3.0 and 2.0.
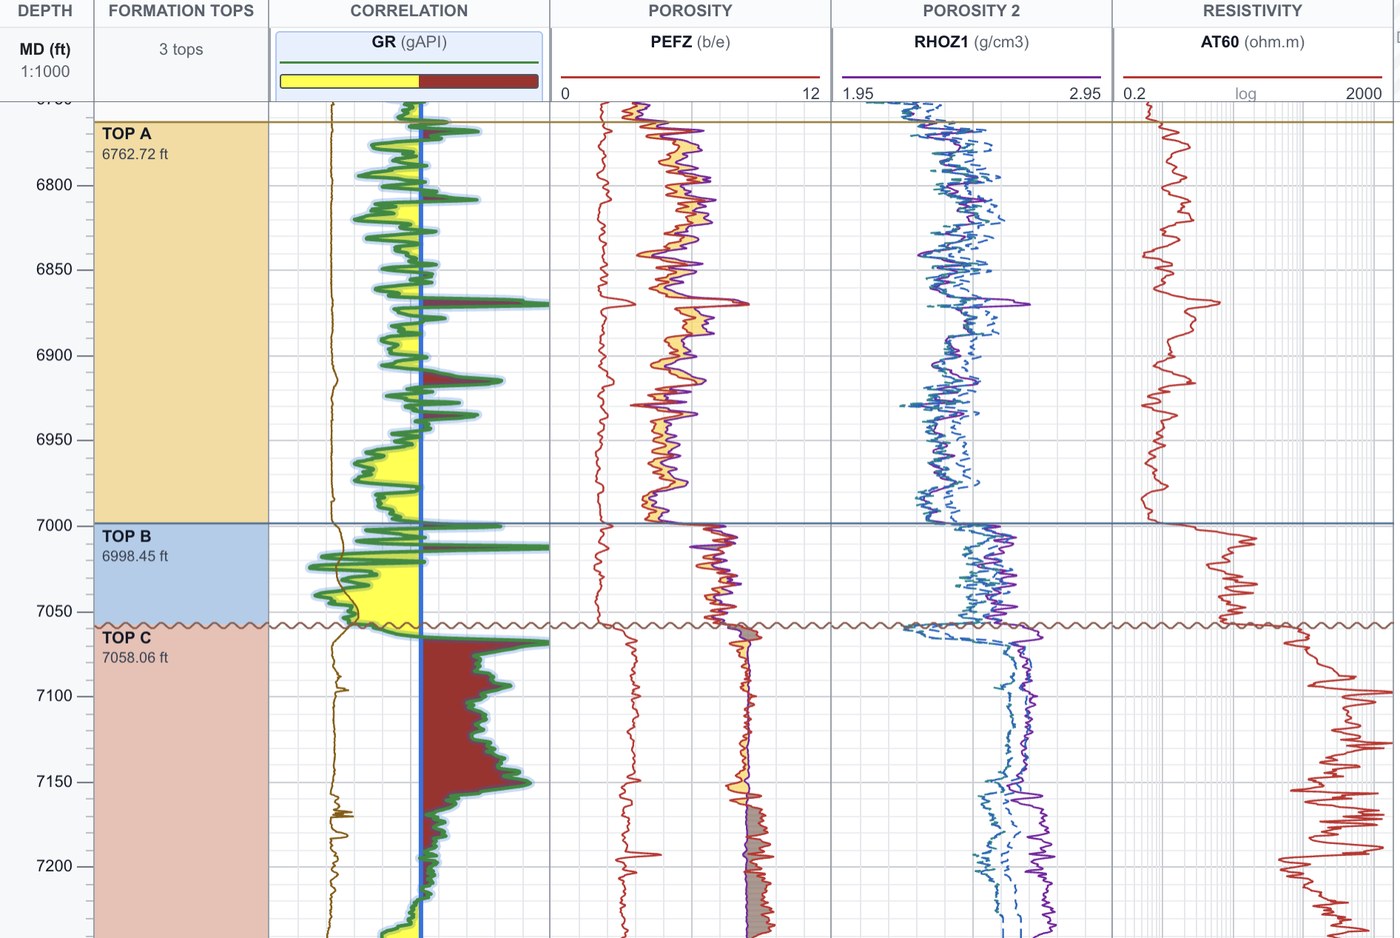
Send the curves to LogPlot Studio to view them as a LAS file online, build tracks and make well correlation charts. See the well log correlation software page for multi-well work.
FOUR STEPS
The animation above shows the same workflow on a sample log: load, calibrate, trace and export.
Open a PDF, TIFF, PNG, JPEG or WebP image of the log in the workspace, or start with the built-in sample log.
Define the depth interval from two known depths, then enter each curve's left and right values and its linear or logarithmic scale.
Trace with the pen or right-click for automatic tracing, then use the review checks and edit tools to correct the digitized result.
Export the curves as LAS 2.0, LAS 3.0 or CSV, or continue in LogPlot Studio to plot and correlate.
COMMON CURVES
These are examples of curve types you can digitize. You choose and name each curve and set its scale; Log Digitize does not automatically recognize a curve from the image. Track values shown are typical, so always use the scale printed on your log. More detail in well log curves explained.
Shale volume and clean-sand screening.
Fluid and saturation indicators; usually a log scale.
Density porosity and lithology work.
Often plotted with density to flag gas and shale.
Compressional slowness, porosity and tie-ins to seismic.
Permeable-bed indication and shale baseline.
Hole size and washout check for other curves.
Lithology indicator, read with density.
WHO USES IT
Anyone who needs curves from a log that exists only as an image, for subsurface characterization, well-log interpretation and geological research.
Turn old paper logs from legacy wells into curves for prospect review, tops picking and correlation.
Bring scanned logs into the same plots as modern LAS data so older wells can be part of interpretation.
Convert archived well-log collections into digital data, one calibrated log at a time.
Recover curves from published figures and theses, and teach log calibration with a sample log in the browser.
Digitize gamma, resistivity and SP logs from water and monitoring wells to characterize aquifers and confining layers.
Add legacy wells to subsurface characterization of storage reservoirs and seals, with curves ready for correlation.
QUESTIONS
Well log digitizing software converts a picture of a well log, such as a scanned paper log, into digital depth-and-value curves. In Log Digitize you calibrate the depth and curve scales on the scan and then trace each printed curve, so the result can be used in LAS-based software and plots.
Yes. Scan the paper log and open it as a PDF, TIFF, PNG, JPEG or WebP file. You choose the interval to digitize, calibrate it and trace the curves in your browser.
Yes. Traced curves can be exported as LAS 2.0 or LAS 3.0, or as CSV, at the depth interval you choose. Untraced depths are written as null (−999.25). Excel and text exports are in the advanced tools.
Yes. Right-click the printed curve to follow it automatically, or place a seed point and use the assist tool. Automatic tracing is a starting point: you review the result and can correct it with the pen. Clean, high-resolution scans work best, and manual tracing is always available.
Yes. Add as many curves as the log has. Each curve gets its own name, unit and left and right scale values, and can be linear or logarithmic. You can export any combination of the traced curves together.
Yes, you can use it as a free well log digitizer for your first log. Each account includes one free log, with calibration, tracing, review and repeat LAS and CSV exports for that log. Additional logs are $10 each. For larger projects there are three-month ($100) and annual ($300) plans. Pricing is on the home page; it is not unlimited free digitizing.
No. Log Digitize runs in a modern web browser. You sign in to use the workspace, and you can open the built-in sample log to learn the tools first.
On your computer. Scans, traced curves and exports are processed in your browser and saved to a folder you choose or to files you download; they are not uploaded to or stored on the Log Digitize website. The account side keeps only what is needed for sign-in, purchases and your log allowance. See the privacy policy.
Turn scanned well-log curves into usable digital data with Log Digitize's browser-based tools.
Start Free — Digitize Your First LogOne free log per account, then $10 per log. See pricing · Read the guides